 When you entrust your loved one to a nursing home in Bellingham or Whatcom County, you expect them to receive the highest quality care and attention. Unfortunately, nursing home abuse and neglect are tragically common in facilities across the United States, including right here in our community.
If your elderly or disabled family member suffered mistreatment in a nursing home, the experienced Bellingham nursing home abuse attorneys at Walton Law can hold the facility accountable and fight for the justice and compensation your loved one deserves.
Bellingham Nursing Home Abuse Guide
- Why Choose Walton Law for Your Nursing Home Abuse Case?
- Types of Nursing Home Abuse and Neglect
- Washington’s Vulnerable Adult Statute
- Proving Liability in a Nursing Home Abuse Case
- Damages in Nursing Home Abuse Cases
- Steps to Take if You Suspect Nursing Home Abuse
- Contact a Bellingham Nursing Home Abuse Attorney
Why Choose Walton Law for Your Nursing Home Abuse Case?
Walton Law is a premier personal injury firm with offices in Bellingham. Our founding attorney, Christopher C. Walton, is a nationally recognized trial lawyer who has been honored as a Super Lawyer every year since 2013. Chris has also earned the highest possible rating, AV Preeminent, from Martindale Hubbell.
 At Walton Law, we represent victims of nursing home abuse and neglect and their families. Our compassionate personal injury attorneys in Bellingham understand the devastating impact that elder abuse can have on both the victim and their loved ones, and we are committed to holding negligent facilities accountable.
We have the knowledge, resources, and dedication to take on even the most complex cases and well-funded defendants, including major nursing home chains and their insurers.
Our Bellingham office is conveniently located at 2219 Rimland Drive #301, just minutes from several local nursing homes, including Shuksan Healthcare Center, Mount Baker Care Center & Summit Place, and North Cascades Health and Rehabilitation Center.
No matter which facility your loved one is in, our team is ready to come to you for a free consultation at your home, the nursing home, or any other location that is most convenient for you.
Types of Nursing Home Abuse and Neglect
Nursing home abuse and neglect can take many forms, including:
- Physical abuse, such as hitting, slapping, pushing, or restraining a resident
- Sexual abuse, including sexual assault or harassment
- Emotional abuse, such as yelling, threatening, or humiliating a resident
- Neglect or failing to provide necessary care, such as food, water, medication, or assistance with hygiene
- Financial exploitation, such as stealing a resident’s money or property or coercing them to change their will or power of attorney
Some common signs of nursing home abuse and neglect include:
 Unexplained injuries, such as bruises, cuts, or fractures
- Bedsores or pressure ulcers
- Dehydration or malnutrition
- Poor hygiene or unsanitary living conditions
- Overmedication or chemical restraint
- Sudden changes in mood or behavior, such as withdrawal or fearfulness
- Unexplained financial transactions or changes to legal documents
If you notice any of these signs or suspect that a nursing home is mistreating your loved one, take action to protect their safety and legal rights.
The skilled nursing home abuse attorneys at Walton Law can help you investigate your concerns, report the abuse to the appropriate authorities, and pursue legal action against the responsible parties.
Washington’s Vulnerable Adult Statute
In Washington, the Vulnerable Adult Statute (RCW 74.34.200) provides special protections for victims of elder abuse and neglect.
 Under this law, a vulnerable adult is:
- 60 years of age or older and has the functional, physical, or mental inability to care for themselves
- Found incapacitated under state law
- Developmentally disabled as defined under state law
- Admitted to any facility, such as a nursing home, assisted living facility, or adult family home
- Receiving services from home health, hospice, or home care agencies licensed or required to be licensed under state law
- Receiving services from an individual provider
If your loved one meets any of these criteria and has suffered abuse, neglect, exploitation, or abandonment, you may pursue damages under the Vulnerable Adult Statute. This law allows for the recovery of damages for injuries, pain and suffering, and loss of property related to the mistreatment.
Proving Liability in a Nursing Home Abuse Case
To win a nursing home abuse case in Washington, you must generally prove:
- The nursing home owed your loved one a duty of care to provide a safe and healthy environment and to protect them from abuse and neglect.
- The nursing home breached that duty by allowing abuse, neglect, or exploitation to occur.
- The nursing home’s breach of duty caused your loved one’s injuries or harm.
- Your loved one suffered damages as a result of the abuse or neglect.
Proving these elements can be challenging, especially when dealing with complex medical evidence and well-funded defense attorneys.
At Walton Law, we have the skills and resources to thoroughly investigate your case, gather evidence, and build a compelling argument on your behalf.
We work with trusted experts in fields like geriatric medicine, nursing home administration, and life care planning to demonstrate the extent of the abuse and the impact on your loved one’s health and quality of life.
Damages in Nursing Home Abuse Cases
If a nursing home abused or neglected your loved one in Bellingham, you may recover damages for:
- Medical expenses related to treating injuries or illnesses caused by the abuse or neglect
- Pain and suffering
- Emotional distress and mental anguish
- Loss of enjoyment of life
- Disability or disfigurement
- Financial losses related to exploitation or theft
- Punitive damages, in cases of particularly egregious or intentional misconduct
![]() The value of your nursing home abuse claim will depend on factors like the severity of your loved one’s injuries, the extent of their suffering, and the strength of the evidence against the facility.
The value of your nursing home abuse claim will depend on factors like the severity of your loved one’s injuries, the extent of their suffering, and the strength of the evidence against the facility.
Our seasoned attorneys will carefully assess your case to determine the full scope of damages and aggressively pursue the maximum compensation your loved one deserves.
Steps to Take if You Suspect Nursing Home Abuse
If a Bellingham nursing home abused or neglected your loved one, take immediate action to protect their safety and legal rights. Here’s what you should do:
- Report your concerns to the nursing home administration and the Washington State Department of Social and Health Services (DSHS) at 1-866-END-HARM.
- If your loved one is in immediate danger, call 911 or remove them from the facility if possible.
- Seek medical attention for your loved one’s injuries and document their condition with photos and medical records.
- Gather any evidence of abuse or neglect, such as photos, witness statements, or financial records.
- Contact an experienced nursing home abuse attorney as soon as possible for guidance on your legal options.
At Walton Law, we offer free consultations to help families affected by nursing home abuse understand their rights and explore their legal options. The sooner you reach out to us, the sooner we can start investigating your case and fighting for your loved one’s rights.
Contact a Bellingham Nursing Home Abuse Attorney
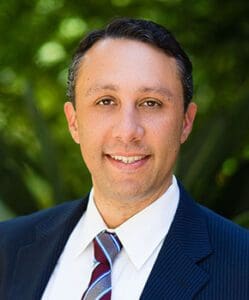
Christopher C. Walton, Nursing Home Abuse Attorney in Bellingham
If your loved one has suffered abuse or neglect in a Bellingham nursing home, the dedicated attorneys at Walton Law are here to help. We understand the anger, frustration, and heartbreak that comes with learning that a nursing home mistreated your elderly family member, and we are committed to providing compassionate, personalized service to help you navigate this difficult time.
Don’t wait to get the legal help you need. Contact us today at (360) 543-1010 for your free, no-obligation consultation with one of our skilled nursing home abuse lawyers. We offer evening and weekend appointments and can even come to you if you cannot make it to our office.
Walton Law, A.P.C. – Bellingham Office Location
2219 Rimland Dr Suite 301,
Bellingham, WA 98226
Phone: (360) 543-1010